There are no items in your cart
Add More
Add More
| Item Details | Price | ||
|---|---|---|---|

BY - Affordable AI Nagpur
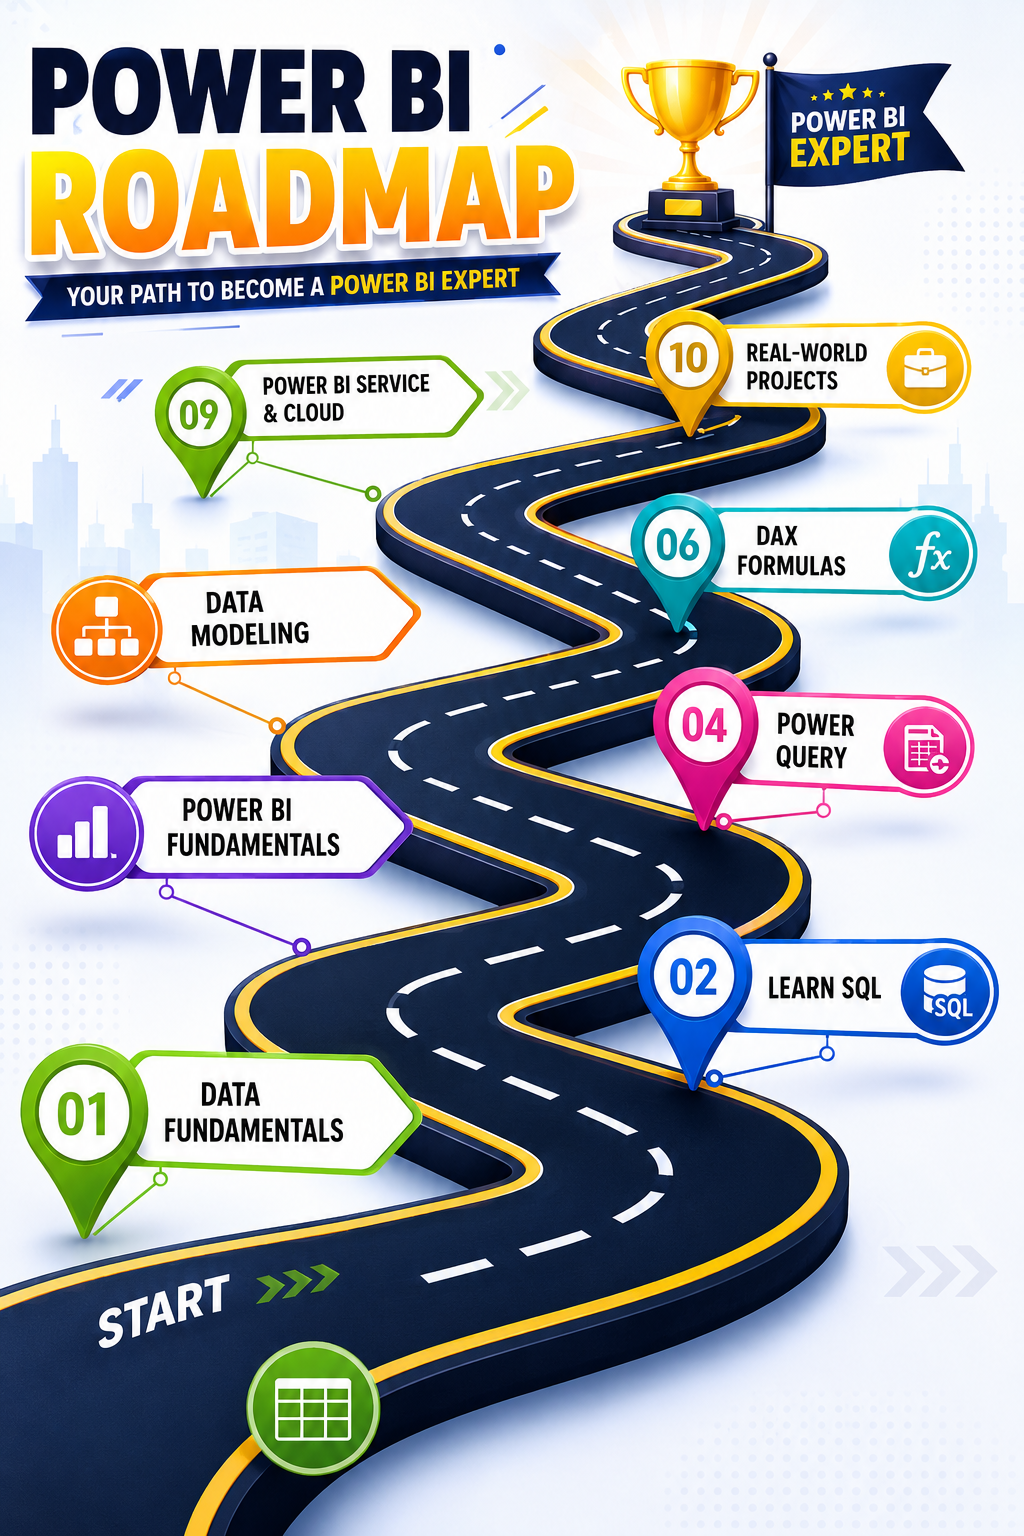
If you want to build a career in data analytics or business intelligence (BI), Power BI is a tool that has become essential to learn. Going beyond Excel to build interactive dashboards and reports — that's the real power of Power BI. In this blog, we'll walk through a structured roadmap that takes you from beginner to expert level.
Power BI is Microsoft's powerful BI tool that converts raw data into interactive insights and decision-ready dashboards. Power BI professionals are in demand across every industry — BFSI, retail, manufacturing, healthcare, consulting — especially in companies that run on Microsoft infrastructure.
In 2023, Microsoft launched Fabric — a unified analytics platform that brings together data engineering, warehousing, and real-time intelligence. Power BI now functions as the visualization layer within this Fabric ecosystem, built on top of OneLake (a cloud-first data architecture). This means Power BI is no longer just a reporting tool — it's become part of a much larger analytics ecosystem.
Stage 1: Foundation (Month 1)
Start by understanding the basics:
Stage 2: Data Layer — Power Query
Many beginners jump straight to visuals, which is a mistake. You need to strengthen the data layer first:
Stage 3: Model Layer — Data Modeling and DAX
This is the most important stage, and it's where most self-taught analysts get stuck:
Now it's time for visuals:
Stage 5: Publishing and Power BI Service
Once your basics are solid, move forward to:
PL-300 (Microsoft Certified: Power BI Data Analyst Associate) is the most recognized certification in this field. It strengthens your resume and validates your skills to recruiters.
Stage 8: Real Projects and Portfolio
Alongside theory, hands-on projects matter just as much:
This entire journey can be completed in 6 to 12 months with consistent practice:
| Duration | Focus |
|---|---|
| Month 1 | Basics + Power Query |
| Month 2-3 | Data Modeling + DAX |
| Month 4 | Visualization + Dashboards |
| Month 5 | Publishing + Service |
| Month 6+ | Advanced features, Fabric, Certification, Projects |
Conclusion
Learning Power BI doesn't happen by watching random YouTube tutorials — it happens by following a structured roadmap. Starting with the data layer, strengthening the model layer, and then moving to the presentation layer — that's the right sequence. In 2026, employers don't just want people who "know Power BI" — they want people who understand data in business terms and can design scalable analytics solutions.
With consistent practice, real projects, and certification, you can build a strong career in Power BI.
 Launch your Graphy