There are no items in your cart
Add More
Add More
| Item Details | Price | ||
|---|---|---|---|

Servers, databases, CDNs, caching, and load balancing: a technical deep-dive into what really happens behind the scenes when traffic explodes, and how to survive it.
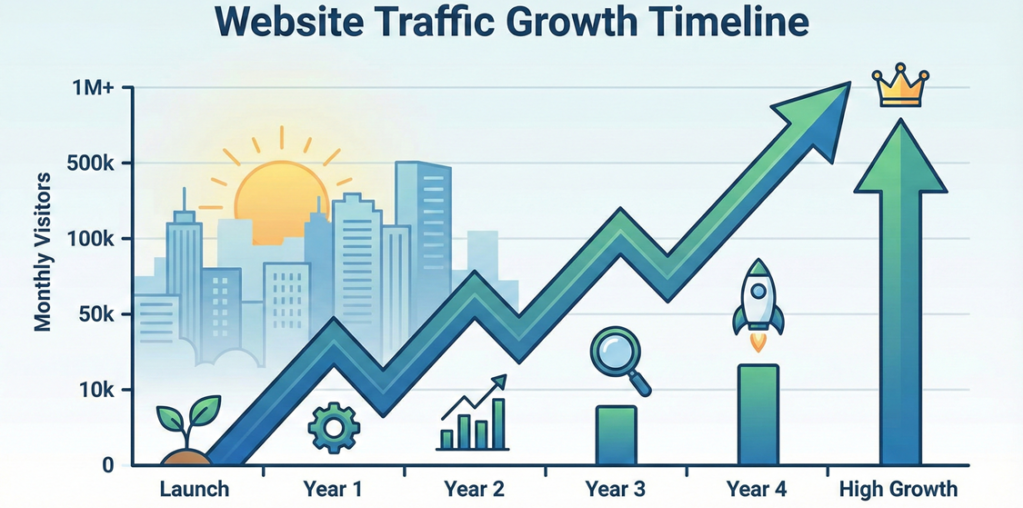
Imagine your blog goes viral, or a massive sale goes live. Suddenly, a million people hit your website within minutes. Will it keep running, or will visitors be greeted with a "503 Service Unavailable" error? In this guide, we walk step by step through what happens inside your servers, database, network, and code when millions of visitors arrive.

Before understanding heavy traffic, you need to know what happens on a single click. Every visitor's request passes through several stages, and every stage is a potential bottleneck.
DNS Lookup: The browser converts the domain name into an IP address. A slow DNS provider can waste 100-300ms before anything else even starts.
TCP + TLS Handshake: A secure connection is established. Millions of users mean millions of handshakes, which are CPU-intensive.
CDN / Edge Check: If static files (images, CSS, JS) are cached at the edge, the request never reaches your origin server.
Load Balancer: The request is routed to one of the available application servers.
Application Server: Business logic runs here: authentication, page rendering, and API calls.
Database / Cache: Data is fetched. This is the most common bottleneck of all.
During a traffic spike, things do not fail randomly. There is a predictable order. These are the four most common failure points:
The server CPU hits 100%, requests pile up in queues, and response times stretch into seconds.
Every connection consumes RAM. When memory runs out, the OS kills processes (the OOM Killer).
The connection pool fills up, slow queries create locks, and the entire application grinds to a halt.
The network pipe gets saturated. Large images and videos consume the most bandwidth.

| Parameter | Basic Shared Hosting | Scalable Cloud Setup |
|---|---|---|
| Concurrent Users | ~100-500 | Millions (auto-scaling) |
| Servers | 1 shared server | Multiple servers + load balancer |
| Static Delivery | From origin server | From global CDN edge |
| Database | Single instance | Primary + read replicas + cache |
| Failure Handling | Entire site goes down | Automatic failover, zero downtime |
| Cost Model | Fixed, low | Pay as you use |
CDNs like Cloudflare and CloudFront serve static content from servers close to the user, often cutting origin load by 70-90%.
Algorithms such as round-robin, least-connections, and IP-hash spread traffic evenly across multiple servers.
Redis or Memcached keeps frequently used data in RAM, answering in microseconds instead of querying the database.
When CPU crosses about 60%, new servers start automatically, then shut down again when traffic drops.
Writes go to the primary, reads go to replicas. Sharding splits data across separate databases.
Heavy jobs like emails, payments, and reports move to Kafka or RabbitMQ and run in the background.
Limit bots and abusive clients so real users get resources. It also helps defend against DDoS attacks.
Prometheus, Grafana, and Datadog track latency, error rates, and saturation in real time.
WebP images, Gzip/Brotli compression, lazy loading, and minified JavaScript can cut page weight in half.
Caching is the cheapest and most effective fix. If 1 million users request the same homepage, hitting the database every time is wasteful. Render it once, cache it, and serve everyone the same copy.
In the example above, only the first request reaches the database. For the next 60 seconds, millions of requests are served from Redis, which can be 10-100x faster than a database query.
Most high-traffic outages trace back to the database. Application servers are easy to clone, but databases hold state. Make sure you do these four things:
Two minutes into the sale, response time hits 12 seconds. At five minutes the database crashes, and by twenty minutes the site is fully down. Revenue and brand trust are both lost.
The CDN absorbs 85% of requests, auto-scaling grows from 4 to 40 servers, and Redis shields the database. Response time stays under 300ms with zero downtime.
Attack your own site before real traffic does. Tools like k6, JMeter, and Locust simulate thousands of virtual users so you can see exactly where the system breaks.
CDN active, load balancer configured, auto-scaling rules set, and multi-region backups ready.
Images compressed, JS/CSS minified, caching headers set, and database properly indexed.
Rate limiting on, WAF enabled, alerts configured, and a rollback plan with an on-call team ready.
No. Vertical scaling (a bigger server) has a hard limit and creates a single point of failure. Horizontal scaling (more servers) is far more reliable.
It depends on hosting, code quality, and caching. An unoptimized shared-hosting site can slow down at just 200-300 concurrent users, while a cloud architecture can handle millions.
For content-heavy sites, a CDN can cut origin traffic by 70-90% and also reduce latency for global visitors.
Start with a CDN, image optimization, and page caching. They cost little and deliver the biggest impact.
Getting millions of visitors is a sign of success, but only if your system is ready for it. Remember: cache everything you can, scale horizontally, protect the database, and always monitor. Testing before traffic arrives is always cheaper than firefighting after it does.
 Launch your Graphy